In MyAutarco you can monitor your PV system. You can both do this in the browser and via the app on your mobile devices. This page will give an in-depth explanation of what all values in MyAutarco mean, and how each is calculated.
Energy flow diagram

The energy flow diagram has two modes; "now" and "today". The first mode shows real-time powers. The second mode shows energy as it has flowed today up to now. You can switch between both modes by clicking the title centered above the diagram.
Data is automatically updated every 5 minutes, and you can fetch new measurements by clicking the Refresh button.

1. Solar power
The sun icon displays the AC power generated by the inverter. The inverter converts the DC power generated by the solar panels into AC power for use in your home, charge the battery or for export into the grid.
2. Battery
If your system includes a battery, the battery icon shows the state of charge (%) as well as how much the battery is charging or discharging (W).
3. Consumption
The house icon displays the power consumption in your house or building. This value is calculated by using the following formula:
Consumption = solar production + import from the grid - export to the grid + battery discharge - battery charge
4. Grid
The electrical tower icon indicates the power being imported from or exported to the grid.
5. Self-consumption
This value indicates in percentage how much of the generated solar energy is being directly consumed by your house or facility.
Self-consumption = ( solar production - export to the grid ) / solar production
6. Self-sufficiency
This value indicates the fraction of your consumption that is covered by your solar production.
Self-sufficiency = ( solar production + battery discharge - battery charge ) / consumption
A higher self-sufficiency percentage means greater independence from the grid and more efficient use of generated solar power.
7. Solar Energy Today
This value indicates the total energy generated by the PV system during the present day, as reported by the inverter.
This value represents a daily performance measurement of your PV system.
8. Solar Energy This Month
Displays the total energy generated by the PV system during the ongoing month, as reported by the inverter.
This value shows the cumulative amount of solar energy generated by your PV system from the first day of the current month. It helps tracking the monthly performance and energy production trends as expected along the year.
9. Solar Energy to Date
Indicates the total energy generated by the PV system over its entire operational lifespan, as reported by the inverter.
This value represents the total solar energy produced from the from the start of your PV system's operation to the present date. It provides an overview of the system's long-term performance and contribution to your energy needs. It helps tracking the annual performance as expected on a long term.
10. Self Sufficiency to Date
Calculates the self-sufficiency for the entire operational lifespan of the PV system.
This value measures how much solar energy you have used to cover your total energy consumption. It is calculated base don the total solar energy produced and consumed since the first day of solar production.
Power graph

The data displayed in the graph primarily comes from inverter messages, with the exception of consumption data, which is calculated using data from a meter or PELD. Values are averaged over 5-minute intervals.
Consumption
Represents the total electricity consumption, calculated as the sum of PV production and net grid import, minus net battery charge. It is calculated using the formula:
Consumption = PV Production + Grid Net Import − Battery Net Charged
This value is always positive, ensuring a clear understanding of energy usage.
Solar Power
Solar Power represents the amount of electricity generated by your PV system. This value is always positive, reflecting the continuous production of solar energy when the sun is shining.
Battery
The Battery value shows the current state of the battery:
-
Positive Value: The battery is charging.
-
Negative Value: The battery is discharging, supplying power to the system.
Grid
The Grid value on the graph indicates the flow of electricity between your system and the utility grid:
-
Positive Value: Energy is being imported from the grid.
-
Negative Value: Energy is being exported to the grid.
Battery (%)
Battery (%) represents the current state of charge of your battery, shown as a percentage. This value, sourced from the inverter message, appears on the right side of the graph to provide a clear visual of battery capacity.
Communication issue
If there is a communication issue with your system, the graph will display a grey background for the duration of the communication loss. This helps identify any periods when data might be missing or incomplete due to connectivity problems. All the values mentioned above can be displayed on a daily or weekly basis.
Energy graph
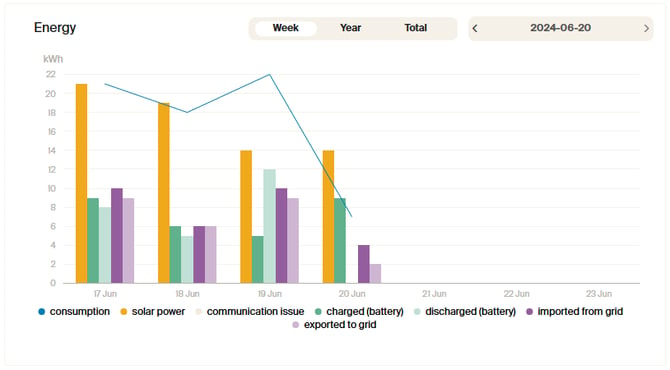
In this section, similar to 11.1, we provide a summary of the entire day's data, also showing the grid import and export amounts separately. Additionally, you can view this data on a weekly, yearly, and total basis.
Additional features

If to display certain kind of data requires a meter, the card will be shown like this:
“You need a smart meter for this KPI. You can reconfigure your statistics or reach to your dealer to get a quote for smart meter installation.“
Solar Energy Today
This value indicates the total energy generated by the PV system during the present day, as reported by the inverter.
This value represents a daily performance measurement of your PV system.
Solar Energy This Month
Displays the total energy generated by the PV system during the ongoing month, as reported by the inverter.
This value shows the cumulative amount of solar energy generated by your PV system from the first day of the current month. It helps tracking the monthly performance and energy production trends as expected along the year.
Solar Energy to Date
Indicates the total energy generated by the PV system over its entire operational lifespan, as reported by the inverter.
This value represents the total solar energy produced from the from the start of your PV system's operation to the present date. It provides an overview of the system's long-term performance and contribution to your energy needs. It helps tracking the annual performance as expected on a long term.
CO2 Offset Today
CO2 offset today represents the amount of carbon dioxide emissions avoided by using solar power instead of conventional energy sources for the current day. It is calculated by considering the energy produced by a PV system in kilowatt-hours (kWh) and the carbon intensity of the electricity grid in the specific country or region. The carbon intensity reflects how much CO2 is emitted per kilowatt-hour of electricity produced using traditional methods, such as coal, natural gas, or oil. By generating solar energy, we can avoid these emissions. For countries without specific data, a world average is used. This metric helps PV owners and installers understand the immediate environmental impact of their solar energy systems on a daily basis.
CO2 Offset This Month
CO2 offset this month measures the total amount of carbon dioxide emissions prevented by using solar power over the course of the current month. Similar to the daily calculation, it takes into account the cumulative energy produced by a PV system in kilowatt-hours and the corresponding carbon intensity of the local electricity grid. This monthly perspective provides a broader view of the environmental benefits of solar energy, showing how much CO2 emissions have been avoided throughout the month. This information is valuable for both PV owners and installers to assess the ongoing environmental impact and effectiveness of their solar installations over a longer period.
CO2 Offset To-Date
CO2 offset to-date reflects the total amount of carbon dioxide emissions avoided since the installation of the solar power system. This cumulative measure considers all the energy produced by the PV system in kilowatt-hours from the time of installation up to the present day, along with the carbon intensity of the electricity grid. It offers a comprehensive overview of the long-term environmental benefits provided by the solar installation. This metric is particularly useful for PV owners and installers to evaluate the overall impact and return on investment in terms of CO2 emission reductions over the lifespan of the solar energy system.
Consumption today
Represents the total electricity consumption for the current day, calculated as the sum of PV production and net grid import, minus net battery charge. It is calculated using the formula:
Consumption Today = PV Production Today + Grid Net Import Today − Battery Net Charged Today
This value is always positive, ensuring a clear understanding of energy usage on a daily basis.
Consumption this month
Represents the total electricity consumption for the current month, calculated as the sum of PV production and net grid import, minus net battery charge. It is calculated using the formula:
Consumption This Month = PV Production This Month + Grid Net Import This Month − Battery Net Charged This Month
This value is always positive, providing a comprehensive view of energy usage over the month.
Consumption to date
Represents the total electricity consumption from the start of the recording period to the current date, calculated as the sum of PV production and net grid import, minus net battery charge. It is calculated using the formula:
Consumption To Date = PV Production To Date + Grid Net Import To Date − Battery Net Charged To Date
This value is always positive, offering a clear and cumulative understanding of energy usage over time.
Grid Import Today
Represents the total electricity imported from the grid for the current day. It is calculated by summing up all the negative values from each phase of the system for today.
Grid Import Today = ∑(Negative Values from Each Phase Today)
This value reflects the total amount of power drawn from the grid on a daily basis.
Grid Import This Month
Represents the total electricity imported from the grid for the current month. It is calculated by summing up all the negative values from each phase of the system for the month.
Grid Import This Month = ∑(Negative Values from Each Phase This Month)
This value shows the cumulative power imported from the grid over the month.
Grid Import To-Date
Represents the total electricity imported from the grid from the start of the recording period to the current date. It is calculated by getting AC Energy In Total from meter message.
Grid Import To-Date = acEnergyInTotal
This value provides a comprehensive view of all the power imported from the grid up to the current date.
Grid Export Today
Represents the total electricity exported to the grid for the current day. It is calculated by summing up all the positive values from each phase of the system for today.
Grid Export Today = ∑(Positive Values from Each Phase Today)
This value reflects the total amount of power sent back to the grid on a daily basis.
Grid Export This Month
Represents the total electricity exported to the grid for the current month. It is calculated by summing up all the positive values from each phase of the system for the month.
Grid Export This Month = ∑(Positive Values from Each Phase This Month)
This value shows the cumulative power exported to the grid over the month.
Grid Export To-Date
Represents the total electricity exported to the grid from the start of the recording period to the current date. It is calculated by getting AC Energy Out Total from meter message.
Grid Export To-Date = acEnergyOutTotal
This value provides a comprehensive view of all the power exported to the grid up to the current date.
Energy Management
For the Energy Management KPI, users who do not yet have access will see "Coming Soon!". Once the EMS is launched, the message will update based on system eligibility. If the system lacks the necessary characteristics, it will display a message saying that system is not eligible. If the system meets the requirements, it will display a message saying that system is eligible.
Self Sufficiency to Date
Calculates the self-sufficiency for the entire operational lifespan of the PV system.
This value measures how much solar energy you have used to cover your total energy consumption. It is calculated base don the total solar energy produced and consumed since the first day of solar production.
Current Solar Power
Current Solar Power represents the amount of electricity generated by your PV system. This value is always positive, reflecting the continuous production of solar energy when the sun is shining.
Inverters section
At the bottom of the page you will find a inverter section. In this section you can find additional information and the ability to see advanced graphs for each inverter. in the inverter section you will find the following information:

- Serial number
- Communication stick
- First and last message received
- IP address
- Product warranty expiration date